
.svg)





What is uncertainty in carbon emissions measurement?
The carbon footprint: an inherently imprecise estimate
The various existing methodologies for calculating carbon footprints were developed to enable organizations to estimate their greenhouse gas emissions based on their activity data: energy consumption, quantity of materials or products purchased, kilometers traveled, etc.
While there are devices and techniques that allow for direct air measurement of greenhouse gas emissions, this approach is obviously not viable for quickly and efficiently measuring emissions induced by business activities, even for the smallest ones. It was therefore necessary, in order to encourage organizations to reduce their emissions, to develop calculation standards that would allow them to "simply" access an estimated value of their gas emissions. This is how the various methodologies for establishing greenhouse gas inventories came into being.
What is commonly referred to as a "company's carbon footprint" is therefore the result of various data collections, themselves measured, and operations (multiplications, sums, extrapolations, etc.) performed on this data. By its very nature, calculating a carbon footprint is an estimate that therefore includes a degree of uncertainty.
It is important to remember that the approach to establishing your company's carbon footprint, is not to compare the result obtained with other players, which would lead to endless debates about calculation methods, but rather to enable the identification of decarbonization levers and to repeat the exercise over time to assess the relevance and effectiveness of the decarbonization efforts deployed by the organization.
Reminder: How is a carbon footprint calculated?
Simply put, calculating a company's carbon footprint involves summing the emissions induced by its activity. The emissions for each induced activity are obtained by multiplying a measured physical activity data point (kWh of energy consumed, euros spent, kilograms of materials purchased, quantities of products bought and sold, m2 of building or land space occupied, etc.) by an emission factor allowing conversion into a single reference unit, the "CO2 equivalent" (CO2e).
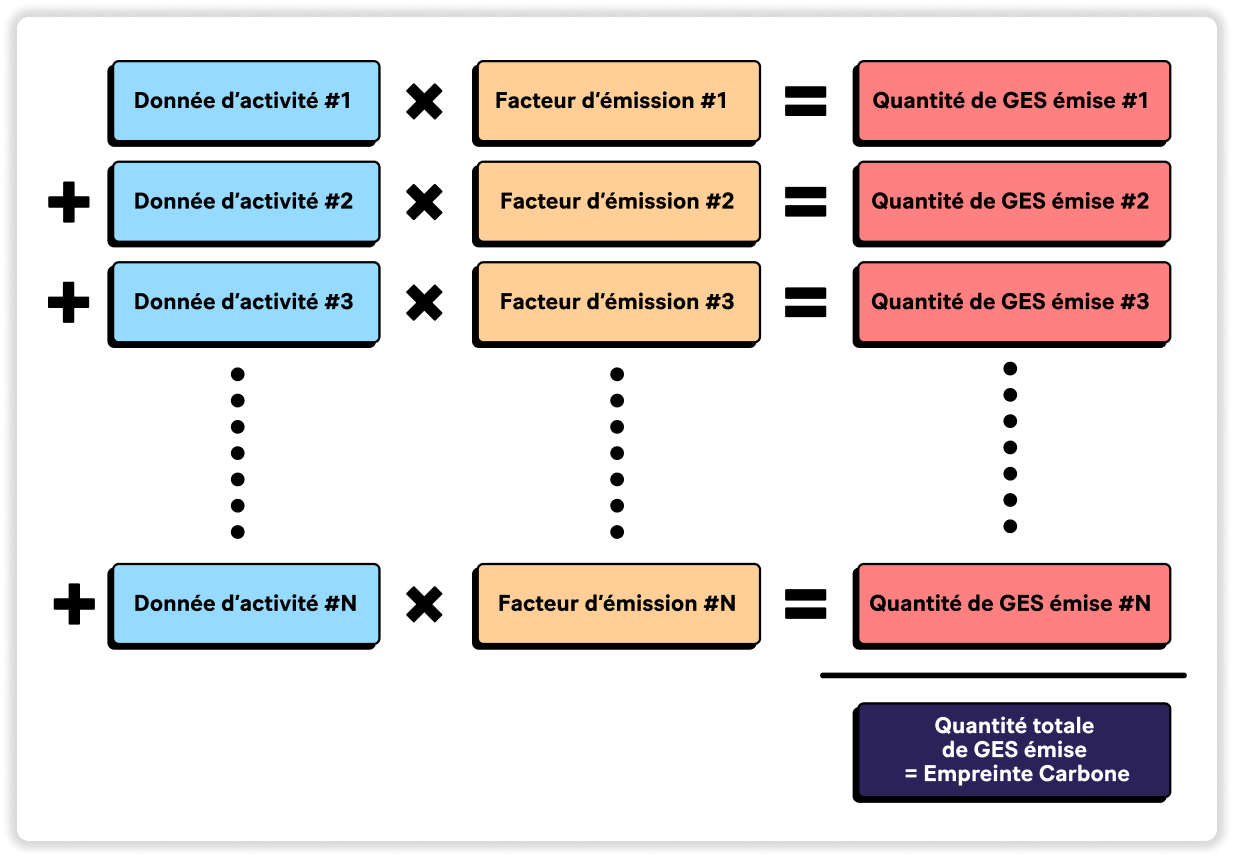
Carbon footprint calculation methods are therefore based on equivalences established between a known quantity of resources consumed by the company and an equivalent quantity of carbon dioxide released into the atmosphere for the production of these resources or activities. For example, we generally consider that the consumption of 1 kg of tomatoes corresponds to 0.624 kgCO2e emitted (during agricultural processes, transport, distribution, etc.).
This conversion is made possible by emission factors. These are calculated using laboratory research, case studies, averages and extrapolations, etc.
What are the sources of uncertainty when calculating a carbon footprint?
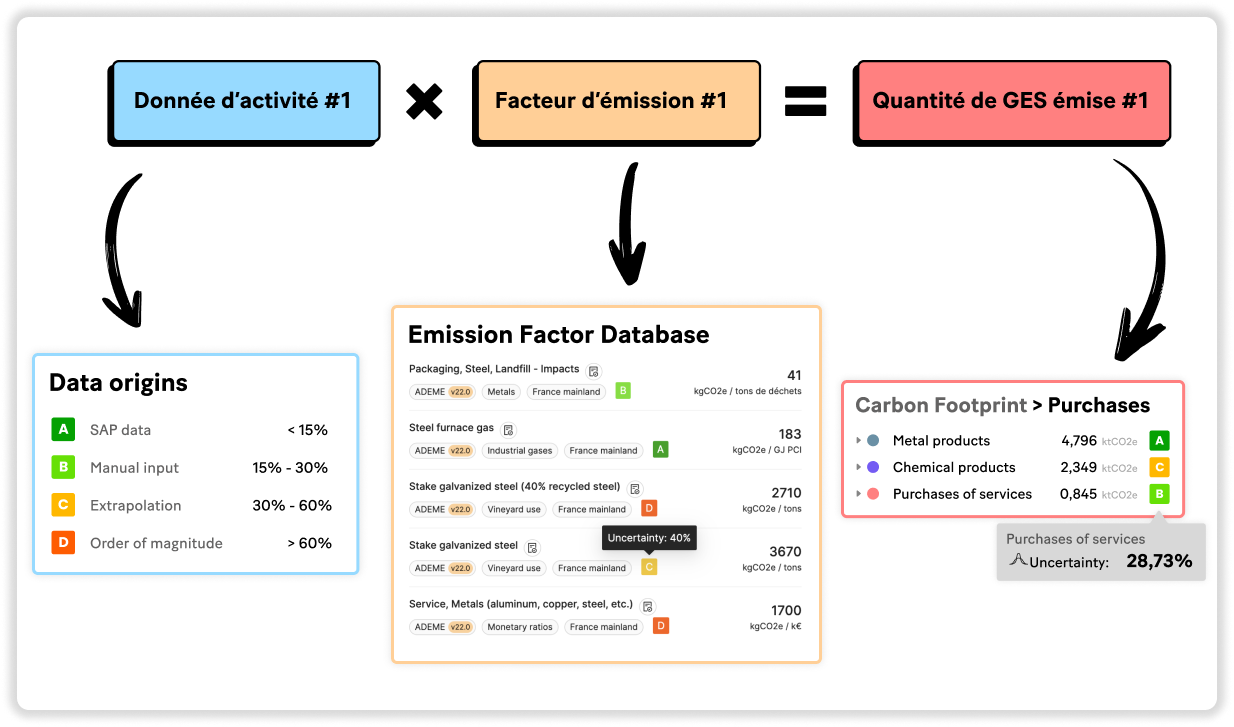
When conducting a greenhouse gas (GHG) assessment, uncertainty primarily arises in two areas: the activity data collected and the emission factors (EF) chosen. This results in uncertainty regarding the final calculated total GHG emissions.

Since GHG accounting relies on the multiplication and summation of data, all of which carry a level of uncertainty, the final result for the total quantity of GHG emitted also carries a level of uncertainty. In this case, we refer to it asaggregation of uncertainty. This is why it is also important to always consider a Carbon Footprint Assessment as an order of magnitude and not an exact value.
The reasons for the uncertainty associated with activity data and emission factors are numerous :
- Lack of completeness : the quantity of source data affects accuracy.
- Lack of reliability: the quality of measurement or the level of estimation.
- Lack of temporal representativeness: the "freshness" of the data, whose last update may be outdated.
- Lack of geographical representativeness: the correspondence of data used to estimate the local reality.
The uncertainty associated with activity data
The level of uncertainty of the activity data is empirically determined based on their origin and quality.
- If the data is measured or “specific,” the uncertainty is estimated to be between 0 and 5%. This is the case, for example, for electricity consumption data read from a meter.
- If the measurement is extrapolated or “semi-specific,” the uncertainty is estimated at 30%. For example, if electricity meter readings are only possible for 3 out of 5 company sites, data extrapolation can be performed for the remaining 2 sites, and the result will therefore carry a greater uncertainty.
- If the measurement is statistical or “generic,” the estimated uncertainty is 50%. This corresponds, for example, to statistics on the average home-to-work commute for French people.
This uncertainty categorization is established in France by the Association for Low Carbon Transition (ABC), which also champions and disseminates the reference methodology known as Bilan Carbone®.
Uncertainty associated with emission factors
For emission factors, the uncertainty stems from how the emission factor was determined, as well as the number and precision of the parameters involved in its calculation. ADEME, which offers one of the world's largest emission factor databases, provides an uncertainty estimate for most of its emission factors, along with documentation on the factor's origin to clearly explain the calculation method for each emission factor.
A “low” uncertainty, around 5%, corresponds, for example, to the emission factor for fuel combustion. The amount of CO2 emitted by burning one liter of fuel can be measured quite precisely. Depending on combustion conditions, not all consumed fuel will transform into CO2 (unburnt matter, VOCs, etc.), which explains the persistent low uncertainty.
A high uncertainty, around 50%, corresponds, for example, to the CO2e emission factors per kilometer for a road freight vehicle. In this case, actual emissions can vary depending on driving style, weather, topography, and the truck's actual load factor.
The uncertainty associated with monetary emission factors is much greater than that associated with physical emission factors. Indeed Monetary emission factors generally carry an uncertainty of around 80%. This is particularly true for most monetary emission factors found in the ADEME database.
This is why it is preferable, whenever possible, to use data specific to one's own case rather than general data. Taking the example of road freight, using data on one's own fuel consumption is better than general data on average emissions per km.
To reduce the uncertainty of an assessment, reference organizations recommend using physical and specific activity data and choosing the most specific emission factors possible. It is therefore strongly recommended to use monetary data only as a last resort to ensure a carbon footprint that remains usable over time.
Why is it important to consider uncertainty when conducting a Carbon Footprint assessment?
In order to provide excellent reporting, the Bilan Carbone® methodology recommends adhering, among other things, to principles of accuracy and completeness in measured emissions. This means that biases and uncertainties must be minimized while striving to cover as many emissions as possible during the measurement.
Measuring uncertainty also allows for improving the quality of one's Carbon Footprint over time. It should be noted that the precise calculation of uncertainty is not mandatory for all methodological standards, although it is generally encouraged, at least qualitatively. For example, it is mandatory to report uncertainties for emission categories when conducting a Bilan Carbone®, but it is only optional for BEGES and the GHG Protocol.
Tracking and reducing uncertainty in one's carbon footprint allows for:
- identifying sources of uncertainty andimproving the quality of one's assessment of greenhouse gases year after year.
- obtaining a more reliable carbon footprint over time and therefore more actionable for its transition and reduce its impact.
- to have more consistent reports and therefore more easily comparable between different years or different entities.
- to not be biased in identifying its decarbonization levers and prioritizing its decarbonization action plan.
How are the overall uncertainty and the uncertainty associated with emission items calculated?
The uncertainty in activity data and emission factors is generally associated a 95% confidence interval, meaning there is a 95% probability that the true value lies within this interval (e.g., + or - 30%).
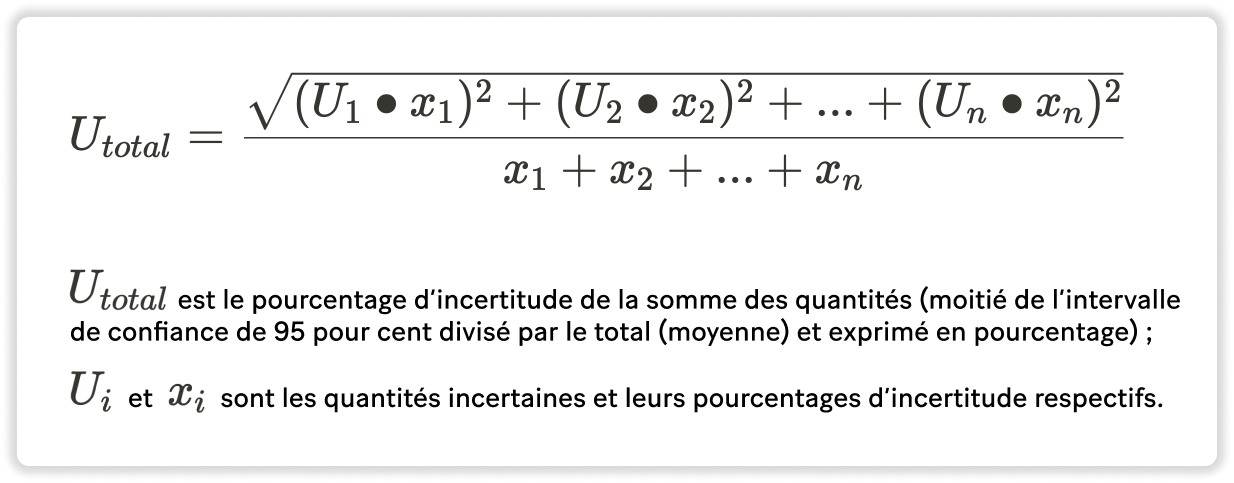
Once all data have an associated uncertainty, two formulas are used to aggregate the uncertainties. The first formula (A) is used to obtain the uncertainty of a sum, expressed as a percentage:
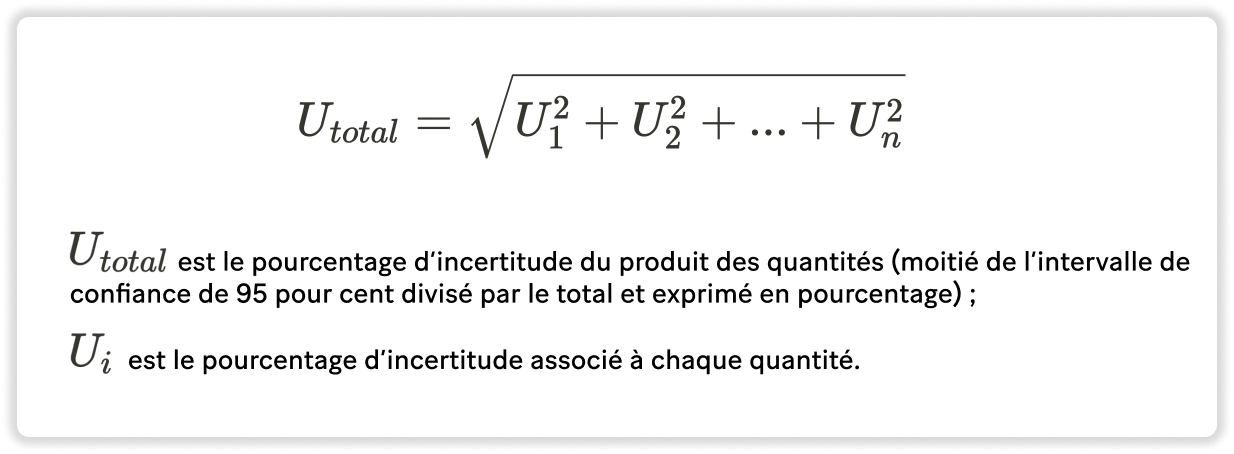
The second formula (B) is used to obtain the uncertainty of a product, also expressed as a percentage:
To obtain the uncertainty associated with a company's carbon footprint, we will combine the uncertainties by following these steps:
- Use the first formula (A) to obtain the uncertainty associated with the measurement of activity data for an emission item. The formula being applied to the uncertainties of different measurement points for the same activity data (e.g., the amount of electricity consumed by all of a company's sites).
- Use the second formula (B) to obtain the uncertainty associated with the CO2e value of an emission item. In this case, the formula is applied to the uncertainty of the activity data calculated in the previous step and to the uncertainty of the emission factor used to obtain a CO2e value.
- Finally, the first formula (A) is used again to obtain the uncertainty associated with the company's total emissions value. In this case, the formula is applied to the uncertainties of all emission item data calculated by repeating the two previous steps.
Limitations of uncertainty calculation in carbon footprint analysis
We observe from the preceding sequence of formulas that the more values we have, the more the total uncertainty tends to decrease. This is both interesting because it obviously encourages comprehensiveness in data collection, but it can also potentially lead to biased analysis of the results by reducing the weight of uncertainty associated with certain data or emission items.
For example, when calculating an emission item. A company that collects extensive spending data from various suppliers for the same product and uses a single, highly uncertain monetary emission factor to derive equivalent emissions would end up with a medium to low final uncertainty for its emissions. The problem here is the resulting analytical and decision-making capacity, which prevents answering questions like "Which supplier should I prioritize working with to reduce my Scope 3 emissions?"
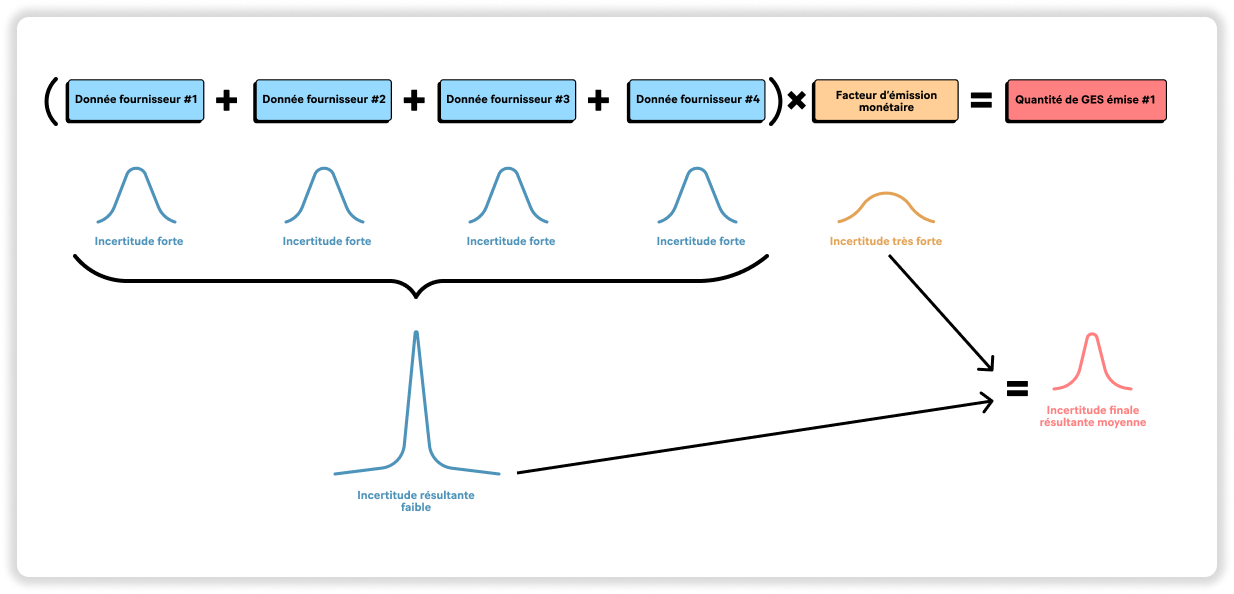
The aggregated uncertainty calculation formulas presented previously are based on the assumption of low correlation between data points, which is not always the case in practice depending on the carbon methodology applied to the source data. In some cases, if correlation between data is not considered, using a large number of source data points can artificially lower the aggregated uncertainty and thus bias the carbon footprint analysis and the levers for action to be considered. In the case of a strong correlation between source data, each carrying high uncertainty, it is preferable not to use the preceding formulas to obtain a realistic and "actionable" resulting uncertainty.
- a carbon footprint with 10 emission items, each having 30% uncertainty, would result in a global uncertainty on the carbon footprint of 20%
- a carbon footprint with 1,000 emission items, each having 30% uncertainty, would result in a overall uncertainty of the carbon footprint of 1%
In the following example, provided by the ABC in its Carbon Assessment methodological guide, the overall uncertainty of the company's carbon footprint would only be 12%, even though the uncertainty associated with the main emission categories (travel and inputs) is above 20%.
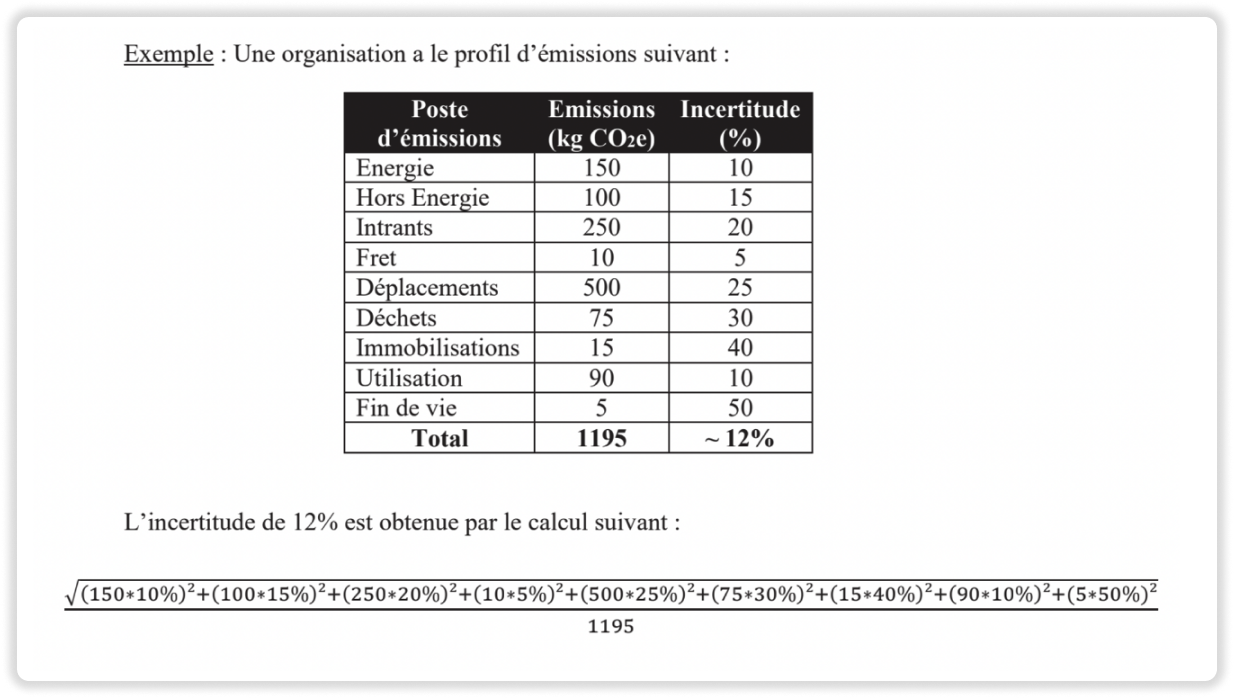
It is therefore very important to always maintain perspective on the uncertainty data calculated during analyses, and always try to achieve low uncertainty by reducing the uncertainty of source data rather than solely based on the volume of data. This means more precise activity data and more precise emission factors as well.
How Traace Integrates Uncertainty Calculation?
The carbon footprint platform from Tennaxia natively integrates the consideration of uncertainty regarding emission factors, activity data, and, of course, in the final carbon emission results. Our clients can freely and easily input the desired uncertainty levels for their source data, as well as for any specific emission factors they might use. Furthermore, we maintain an extensive database of emission factors where uncertainty is automatically provided.
The emission analysis results on our dashboards consistently display total uncertainty levels, and granularly by category and emission source.
Our carbon accounting philosophy to limit uncertainty
As we have seen, uncertainty in carbon footprint calculation occurs at two levels where action can be taken: Activity data collected and the choice of emission factors.
At Traace, we understand the importance of relying on clear and precise activity data, but also on reliable emission factors that vary as little as possible depending on conditions, even if it means regularly updating activity data to make them consistently more precise according to your company's situations and contexts.
This is why, at Traace, we always strive to use physical emission factors and to support our clients in collecting precise and exhaustive activity data. This is essential for obtaining a high-quality carbon footprint assessment that is, above all, actionable as a starting point for their decarbonization strategy. Traace teams are also responsible for updating the emission factors in the databases available on the platform, ensuring that our clients' carbon footprint assessments are always as up-to-date as possible.
A data collection module designed to simplify this step and reduce uncertainties
Data collection (gathering activity data and corresponding emission factors) is the most time-consuming phase in the process of establishing a GHG assessment. While methodologies recommend balancing data collection efforts with objectives, they also specify that data with high uncertainty (e.g., statistical averages) are indeed easier to find, but their use is not recommended.
At Tennaxia, in order to enable our clients to avoid compromising between quality and quantity, and to collect as much precise data as possible, we have developed a high-performance data collection module that allows for structuring collections through campaigns made up of 100% customizable questionnaires.
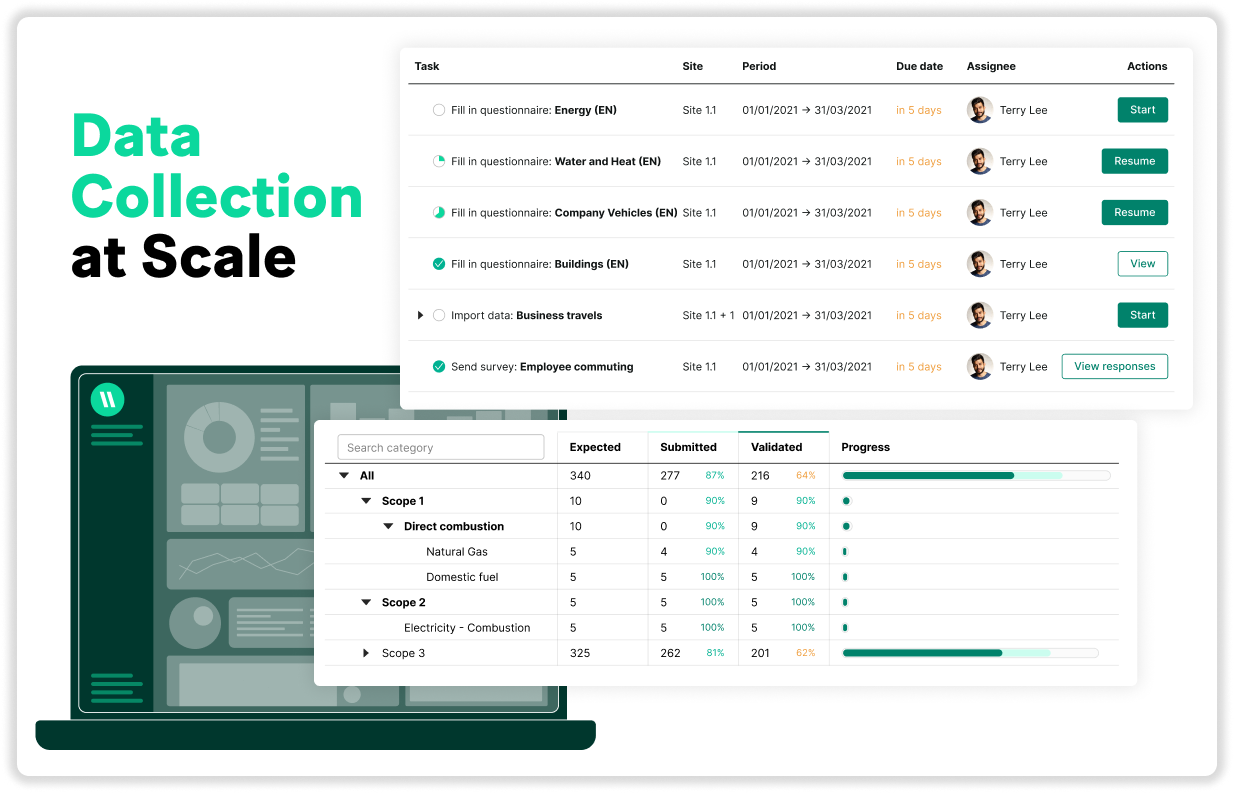
Our module therefore allows for simply engaging relevant stakeholders, collecting precise data, and limiting sources of error very common with Excel, as well as collaboratively managing the progress of data collection to meet their carbon footprint measurement and analysis objectives.
To learn more about how Tennaxia can help you with your climate impact data collection, contact us!
-------
Sources:
- IPCC - Good Practice Guidance and Uncertainty Management in National Greenhouse Gas Inventories - https://www.ipcc-nggip.iges.or.jp/public/gp/english/
- GHG - Quantitative Inventory Uncertainty Guidance
- Bilan Carbone® V8 : Guide méthodologique (Annexes) - https://abc-transitionbascarbone.fr/ressource/bilan-carbone-v8-guide-methodologique-annexes